Tutorial: Improve text visualization in Python with Wordcloud
If your data contains text and you want to have interesting visualization out of your data. Instead of showing it in graphs (bar/line) which are not strongly associated with the idea of text analysis. It is way better and interesting to apply Wordcloud.

This tutorial is here to give you a simple and easy way to visualize your text data using Wordcloud in Python.
Firstly, this is a list of tools and packages you need:
from wordcloud import WordCloud
from PIL import Imageimport numpy as np
import pandas as pd

import matplotlib.pyplot as plt
Why we need such packages?
Wordcloud: to generate from the text the image in the form of wordcloud.
PIL .. image: your Python now can open and read the file in the form of an image (.jpg, or .png).
Numpy and pandas are there as we need to use them to process our data.
Matplotlib for visualization display.
Our data
You have dataset and load it to pandas data frame. I take 1 example which is the dataset from Kaggle. Our data will look like in the below snapshot. Column ‘text’ is where we want to visualize.

Step1: Capture and clean necessary string
It is important to clean our data in this case, so I use regex and string methods to clean content of column ‘text’ belongs to pandas dataframe ‘data_sen’.
(replace to replace, strip to strip of empty space at the begin and end of string, title to uppercase the first letter of each word)
Then, we transform ‘li’ pandas series to a list type ‘l’
Finally, use ‘join’ method to have final text which is the combination of all clean text in the columns.
li=data_sen.text.str.replace(r'#.+$',
'').str.replace(r'@[a-zA-Z0-9]+',
'').str.replace('https',
'').str.strip().str.title()
l=li.to_list()
te=' '.join(l)
Step 2: Create a mask (optional)
If you want your visualization look fancy and creative, I recommend to apply a mask. A mask is like a frame taken from an image/photo where you want your text to appear within a shape.
Since our example data is about Tweet, I take the logo photo of Twister as a mask.
mask1 = np.array(Image.open("image.jpg"))
Photo to satisfy making a mask is: white background, or some white area. The color area will be undertood by Python as value area to fill the Wordcloud in.
Step 3: Create image of Wordcloud
Simply pass the code like this:
w=WordCloud(background_color="white",mask=mask1,width=mask1.shape[1],height=mask1.shape[0]).generate(te)Step 4: Display the visualization
From step 3, we already create an image of Wordcloud named ‘w’, but it haven’t yet in a form to display. We need to use Matplotlib to display. The code to do the job is as below:
plt.figure(figsize=(20,10))
plt.imshow(w,interpolation="bilinear")
plt.axis('off')
plt.margins(x=0,y=0)
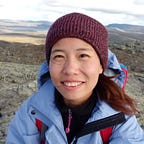
plt.show()So now you will have a result like in this photo. Ting ting! 🌟

P/S: If you like my tutorial, just react. Your interaction will be a motivation and orientation for me to write more topics like this. Thanks 💗